Project View
Selecting the [Project View] button displays a gauge and bar graph with estimated data for the filtered selection, meaning if the Server Project is the selection or if a sub-project is the selection. The gauge provides an overall estimation of the selected project's object and resource limitations against the capacity. Reference System Requirements and Capabilities for a list of the acceptable limitations of a project.
When the key objects and resources are within their limitations and within the capacity of the selected project type limitations, the gauge displays in blue. As the objects and resources in the project are pushing their limits, the gauge and bar will display in red. See Gauge and Bar Graph Overview for guidance on understanding the gauge and bar graph data displayed.
The bar graph to the right of the gauge provides real-time data of the key objects and resources in the Server Project.
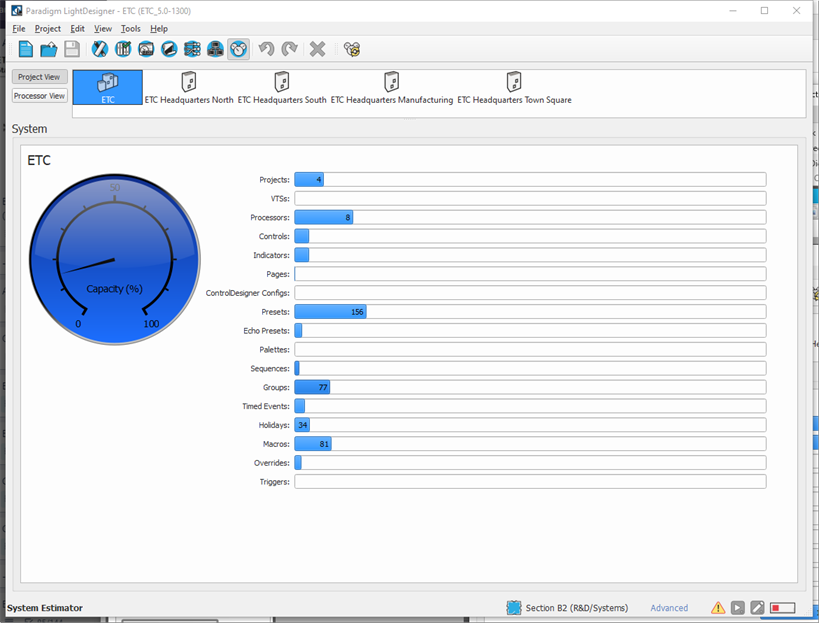
- Projects - Sub-projects within the Server project
- VTSs - Virtual Touchscreens
- Processors - Paradigm Processors (P-ACPs)
- Controls - Buttons, Faders, Contacts
- Indicators - Actions and States
- Pages - Touchscreen configuration pages
- ControlDesigner Configurations
- Presets
- Echo Presets
- Palettes
- Sequences
- Groups
- Timed Events
- Holidays
- Macros
- Overrides
- Triggers
The bar graph to the right of the gauge provides real-time data of the key objects and resources that are in the selected Sub-Project.
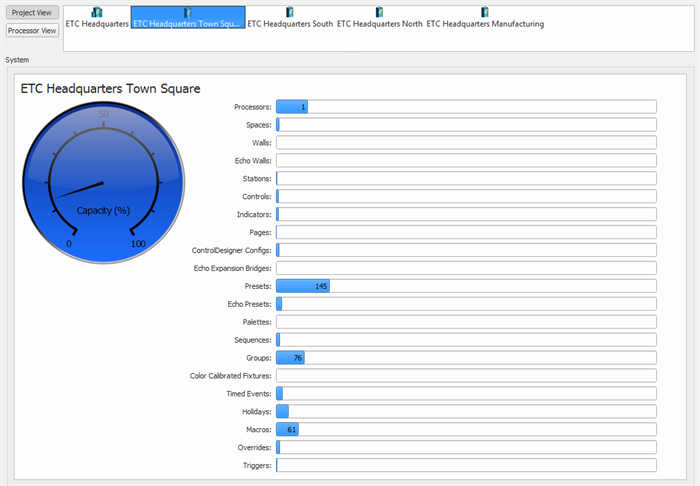
This view details the counts of objects as it is related to the overall limitations of the system.
- Processors - Paradigm Processors (P-ACPs)
- Spaces
- Walls
- Echo Walls
- Stations - includes all connected Ethernet, Link Connect, and Mosaic Integration
- Controls - Buttons, Faders, Contacts
- Indicators - Actions and States
- Pages - Touchscreen configuration pages
- ControlDesigner Configurations
- Echo Expansion Bridges
- Presets
- Echo Presets
- Palettes
- Sequences
- Groups
- Color Calibrated Fixtures
- Timed Events
- Holidays
- Macros
- Overrides
- Triggers